For web experiments, a p-value of 0.05 serves as the standard. This 5 percent error tolerance or the 95% statistical significance level helps optimizers maintain the integrity of their tests. They can ensure the results are actual results and not flukes.
So most experiments (70-80%) are either inconclusive or stopped early.
Correctly reporting a p-value from a fixed-horizon experiment means you need to pre-commit to a fixed sample size or test duration. Some teams also add a certain number of conversions to this experiment stopping criteria and an intended length. “Sequential testing allows you to maximize profits by early deployment of a winning variant, as well as to stop tests which have little probability of producing a winner as early as possible. The latter minimizes losses due to inferior variants and speeds up testing when the variants are simply unlikely to outperform the control. Statistically rigor is maintained in all cases.”
“Given a ten percent chance of a 100 times payoff, you should take that bet every time. But you’re still going to be wrong nine times out of ten. We all know that if you swing for the fences, you’re going to strike out a lot, but you’re also going to hit some home runs. The difference between baseball and business, however, is that baseball has a truncated outcome distribution. When you swing, no matter how well you connect with the ball, the most runs you can get is four. In business, every once in a while, when you step up to the plate, you can score 1,000 runs. This long-tailed distribution of returns is why it’s important to be bold. Big winners pay for so many experiments.”
All said, ending experiments early is still risky…
However, the problem here is that having enough test traffic to fuel every single experiment for optimal stopping using this standard practice is difficult for most websites.
The loss, too, needs to be factored in, because you might have still ended up erroneously calling a winner too soon. But this risk exists even in fixed-horizon testing. External validity, however, may be a bigger concern when calling experiments early as compared to a longer-running fixed-horizon test. But this is, as Georgiev explains, “a simple consequence of the smaller sample size and thus test duration.“
Moving away from traditional stopping rules
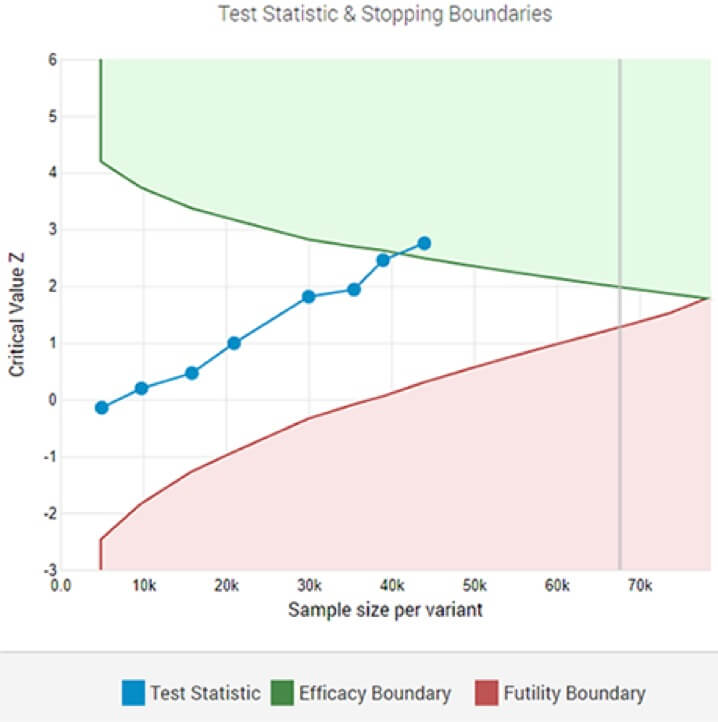
An adaptive A/B test showing a statistically significant winner at the designated significance threshold after the 8-th interim analysis.
… because it leaves the probability that had the experiment run its intended length, powered by the right sample size, its result could have been different. This might not come across as so surprising, given that 50% of optimizers don’t have a standard “stopping point” for their experiments. For most, doing so is a necessity, thanks to the pressure of having to maintain a certain testing velocity (XXX tests/month) and the race to dominate their competition. While such testing can accelerate your decision-making process, there’s one important aspect that needs addressing: the actual impact of the experiment. Ending an experiment in the interim can lead you to overestimate it.
Georgiev has even worked on a calculator that helps teams ditch the fixed sample testing models for one that can detect a winner while an experiment is still running. His model factors in a lot of stats and helps you call tests about 20-80% faster than standard statistical significance calculations, without sacrificing quality. Statistician, author, and instructor of the popular CXL course on A/B testing statistics, Georgi Georgiev is all for such sequential testing methods that allow flexibility in the number and timing of interim analyses: Unlike statistical models that give you the provision to evaluate your data as it’s being gathered, such testing models forbid you to look at your experiment’s data while it’s running. This practice — also known as peeking — is discouraged in such models because the p-value fluctuates almost on a daily basis. You’ll see that an experiment will be significant one day and the next day, it’s p-value will rise to a point where it’s not significant anymore.
Simulations of the p-values plotted for a hundred (20-day) experiments; only 5 experiments actually end up being significant at the 20-day mark while many occasionally hit the <0.05 cutoff in the interim.
Here’s another one of a 30-day long A/A test where the p-value dips to the significance zone multiple times in the interim only to finally be way more than the cutoff:
Moving toward flexible stopping rules that enable faster decisions
It might be a small UI experiment that you can’t practically get “enough” sample size to. It might also be an experiment where your challenger crushes the original and you could just take that bet!
Or as Tom Redman (author of Data Driven: Profiting from Your Most Important Business Asset) asserts that in business: “there’s often more important criteria than statistical significance. The important question is, “Does the result stand up in the market, if only for a brief period of time?”’ … but about better business decisions, as Chris Stucchio says.
Then there’s also the possibility of a negative experiment hurting revenue. Our own research has shown that non-winning experiments, on average, can cause a 26% decrease in the conversion rate!
So how do teams that end experiments early know when it’s time to end them? For most, the answer lies in devising stopping rules that speed up decision-making, without compromising on its quality.
In our recent analysis of 28,304 experiments run by Convert customers, we found that only 20% of experiments reach the 95% statistical significance level. Econsultancy discovered a similar trend in its 2018 optimization report. Two-thirds of its respondents see a “clear and statistically significant winner” in only 30% or less of their experiments.
Of these, the ones stopped early make a curious case as optimizers take the call to end experiments when they deem fit. They do so when they can either “see” a clear winner (or loser) or a clearly insignificant test. Usually, they also have some data to justify it.
In traditional statistical models for fixed-horizon testing — where the test data is evaluated just once at a fixed time or at a specific number of engaged users — you’ll accept a result as significant when you’ve a p-value lower than 0.05. At this point, you can reject the null hypothesis that your control and treatment are the same, and that the observed results are not by chance. Here’s where using sequential testing methods that support optional stopping rules helps.
In the end… It’s not about winners or losers…
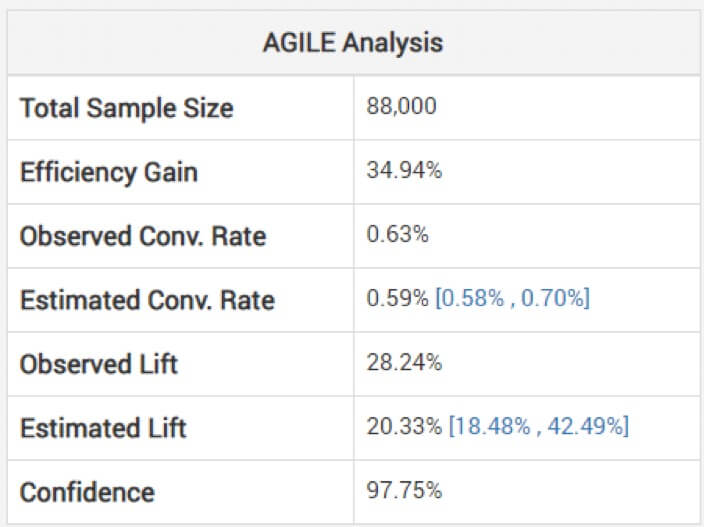
Looking at non-adjusted estimates for the effect size can be dangerous, cautions Georgiev. To avoid this, his model uses methods to apply adjustments that take into account the bias incurred due to interim monitoring. He explains how their agile analysis adjusts the estimates “depending on the stopping stage and the observed value of the statistic (overshoot, if any).” Below, you can see the analysis for the above test: (Note how the estimated lift is lower than the observed and the interval is not centered around it.)
As Jeff Bezos writes in his letter to Amazon’s shareholders, big experiments pay big time:
Calling experiments early, to a great degree, is like peeking every day at the results and stopping at a point that guarantees a good bet.
The whole essence of experimentation is to empower teams to make more informed decisions. So if you can pass on the results — that your experiments’ data points to — sooner, then why not?
So a win may not be as big as it seems based on your shorter-than-intended experiment.
Sequential testing methods let you tap into your experiments’ data as it appears and use your own statistical significance models to spot winners sooner, with flexible stopping rules.
And it most likely will, and not just for a brief period, notes Georgiev, “if it is statistically significant and external validity considerations were addressed in a satisfactory manner at the design stage.”
Optimization teams at the highest levels of CRO maturity often devise their own statistical methodologies to support such testing. Some A/B testing tools also have this baked into them and could suggest if a version seems to be winning. And some give you full control over how you want your statistical significance to be calculated, with your custom values and more. So you can peek and spot a winner even in an ongoing experiment.
