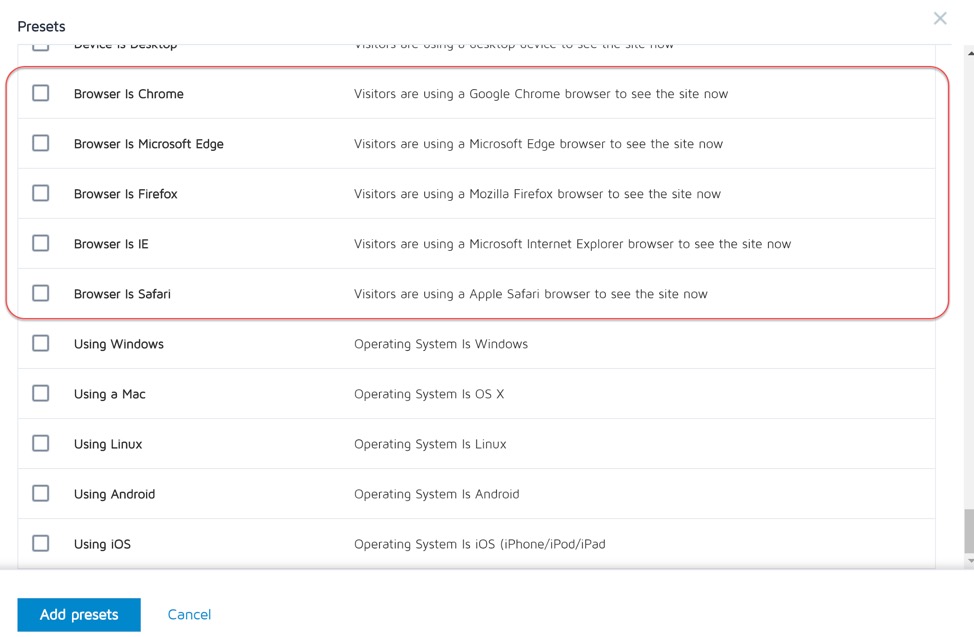
You can simply check your Convert reports with these dimensions to see just how many new vs. returning users you have today against browser traffic and check the changes between the volumes of each over the last period (up to when ITP 2.2 rolled out, around May 1, 2019). Do you see a shift in new vs. returning visitors, especially for Safari?
Yes, probably. This depends on the logic that drives your personalizations. Real-time personalization, where the user experience is shaped by their behavior during that very session, won’t be impacted. But recognizing the preferences and behaviors when they return will now only work if they return to your site within 7 days. Even if Safari, Firefox, and Edge combined comprise less than 20% of your total web traffic, your marketing and advertising analysis will be affected.
Cookies have a shelf-life that isn’t uniform. Depending on the browser visitors use, how they’re engaging with your site, and their browser settings for privacy/data collection, cookies may only be available for 30 days, 7 days, and even only 24 hours before they expire.
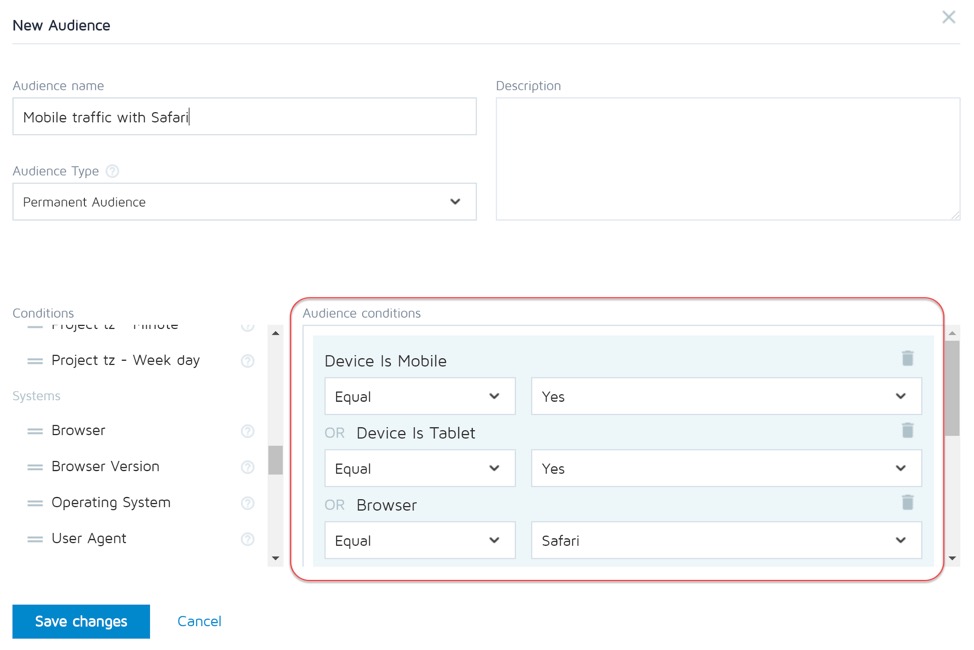
See if the Safari market share statistics apply to your website traffic by using audience conditions based on device type. With this report, you will see how much mobile traffic you receive. From there, apply a secondary dimension by browser to assess the proportion coming from Safari (see example below).
Aggregate user count is not the only user-related metric or dimension affected. The New vs. Returning Users metric is also impacted, with a likely increase in New users and decrease in Returning users.
Contact the Convert team to learn more about solving ITP, ETP, and other cookie expiration related challenges.
More Users and Lower User-Level-Conversion Rates
Anyone that has users coming to their site from Safari, Mozilla Firefox, and Microsoft Edge should perk up, as these browsers have made the most notable changes to measurement. Even Chrome has made updates, though these aren’t affecting cookies as much as the others.
In Convert, you can quickly assess the impact by using audience conditions based on browser type and setting the date range to go 3 months back vs. 3 months before that (or modify that to however long your sales/buying cycle is). What is the percentage of your Safari, Mozilla, or Edge browser traffic in these two-date ranges? You can expect the user counts to differ as time passes and the cookies are cleared/expire.
Here’s a quick look at which metrics will likely be affected–and what to do about it.
100 users from Safari came to your site a year ago; 2 months after their first visit, they all came back on the same browser, and 50 converted. So, your conversion rate is 50% for these 100 users (50 / 100 = 50% across the entire 2-month period).
Despite the worrisome changes listed above, even if a majority of your traffic comes from these browsers, online measurement is not dead. Convert is planning for a cookieless worldsolutions we have in the works, including the server-side cookie setting and the CNAME option.
If you’re getting a lot of mobile traffic to your website, then you should check the size of the impact of Safari’s ITP update. To do this, find out what are your percentage of mobile traffic and the typical sales cycles for your mobile conversions.
This gets even more complicated when you want to ensure cross-domain tracking is in place. Cookie data needs to be passed/shared and this requires even more technical work. To check this, you can either use audience conditions based on New vs Returning users, but apply a secondary dimension by browser or use the audience conditions from above and apply the secondary dimension there.
Are you getting more visits to your site from Safari, Firefox, and Chrome users, but the overall conversion-by-user count is going down?
More New Users and Less Returning Users
While ITP and similar browser changes may seem daunting because they affect online measurement, you can quickly check the severity or impact of these changes.
Here are a few helpful articles from Convert to kick things off:
Convert Experiences uses cookies to determine if/when the same users are coming back to the website using the same browser. When these cookies are deleted or expire, and on return visits, new cookies are created by the Convert tracking code. You then end up tracking yet another new user, even though it’s not a new human.
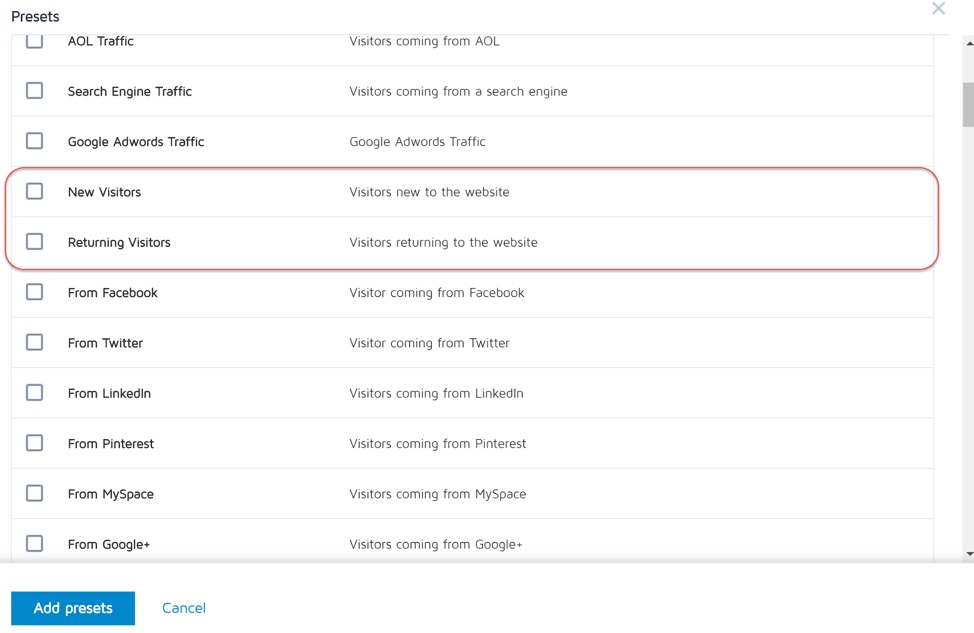
Mobile & Tablet Traffic
Okay, now let’s get into the thick of it!
Because of this, your data can show a gradual increase in user count, which also may reduce your user-level-conversion rates, because you are increasing the denominator in the rate calculation: Conversions / Users = Conversion Rate.
Here’s a scenario that shows this in action:
Personalizations, Will They be Impacted?
The most recent research of mobile browser market share in the U.S. (done by Statcounter, for a period between January and June 2019) placed Safari in first place with 49%, followed by Chrome with 43%. For desktop browsers, Safari only has 8% of the U.S. market share.
Your Next Steps
Before we dive into how ITP (Intelligent Tracking Prevention from Safari), ETP (Enhanced Tracking Protection from Mozilla), and Tracking Prevention from Microsoft Edge are impacting your Convert Experiences Reports, let’s get you up to date on these features.
Let’s assume this same scenario starts today. 100 users from Safari come to your site today, and 2 months after their first visit, they all come back on the same browser and 50 of them convert. In this case, you’d have 200 total users, since their first visit wasn’t stitched with their next visits and they appear as new users. And, since it’s still 50 conversions, your conversion rate is now 25% across the 2-month period. Ouch! You get more users and lower user-level-conversion rates.
