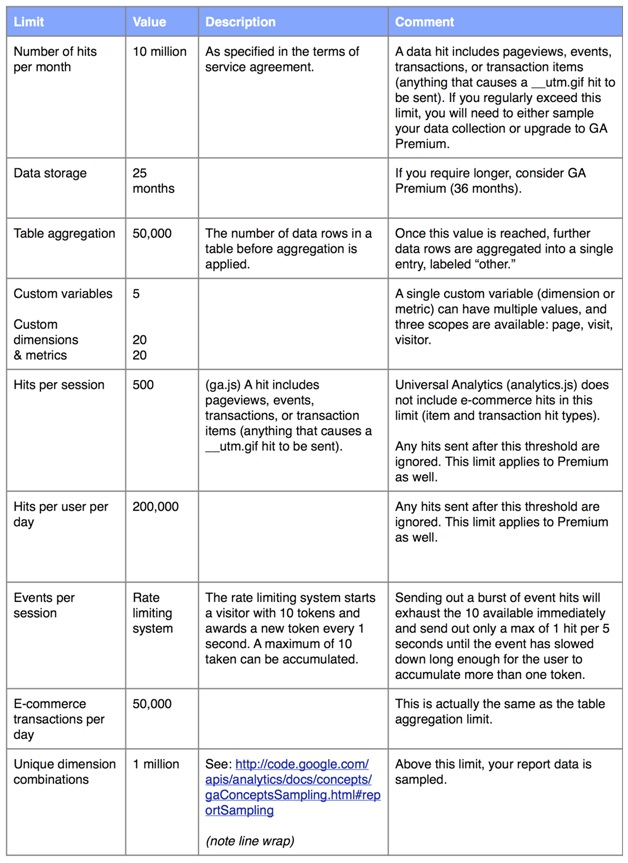
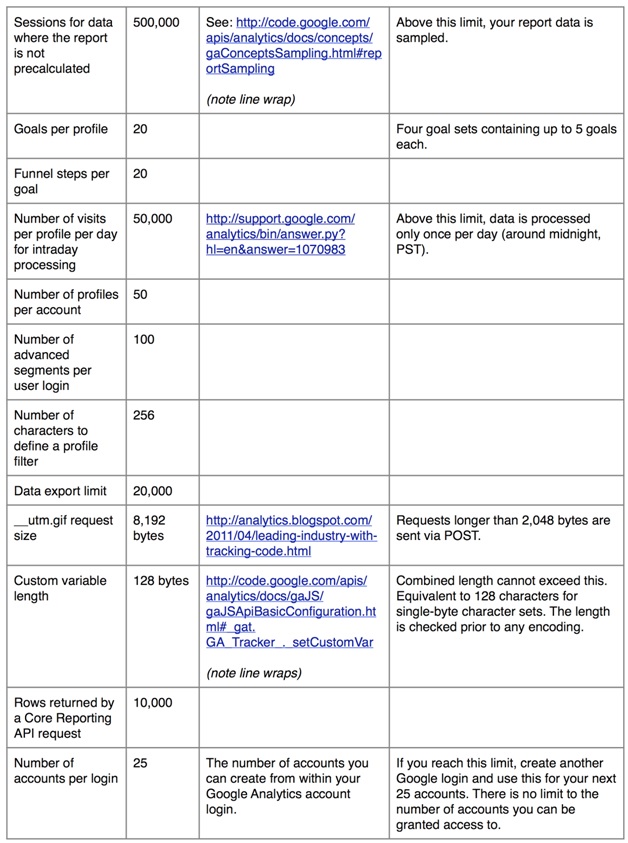
This chart below shows the limits with Analytics.
Here’s how to set it up
Conducting split tests with Google Analytics isn’t a very easy thing to do. Whilst the platform itself is free, creating different pages for split testing is neither free nor easy and takes a lot of valuable time and resources. As such, I feel that you should be going for other options when it comes to A/B testing.
The tool also allows you to track revenue goals. For Analytics to track eCommerce transactions enable eCommerce reporting by choosing yes for the eCommerce website option. Next you need to add a customized tracking code to your shopping cart system that reports back when and how purchases have occurred. Once that is done you can start tracking revenue goals.
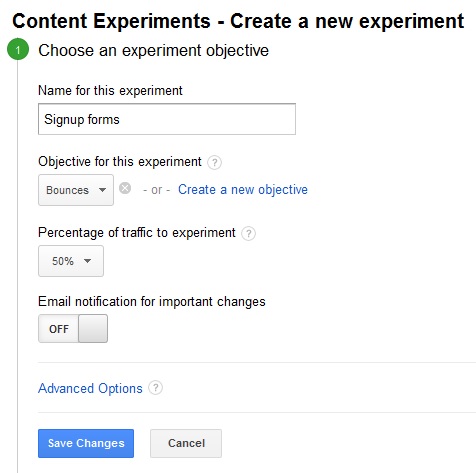
Once you have selected the objective the next step is to assign the traffic. You can divide the web traffic to only show a percent of your visitors the alternate version of your website. There’s also another way to assign traffic. Suppose you have created multiple variations of the landing page. In that case you can click on Advanced options followed toggling on the Distribute traffic button to assign traffic equally to all the variations.
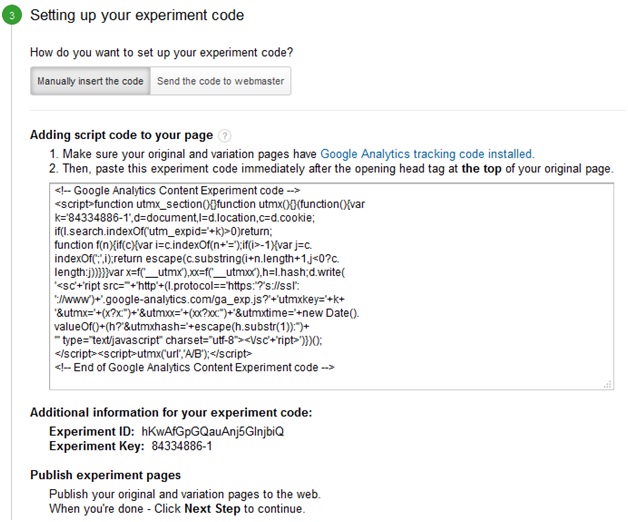
Place this between the <head> </head> tags opening head tag at the top of your original web page. Once it’s added, hit the “Save Changes” button again to progress to the final step. The code looks something like this:
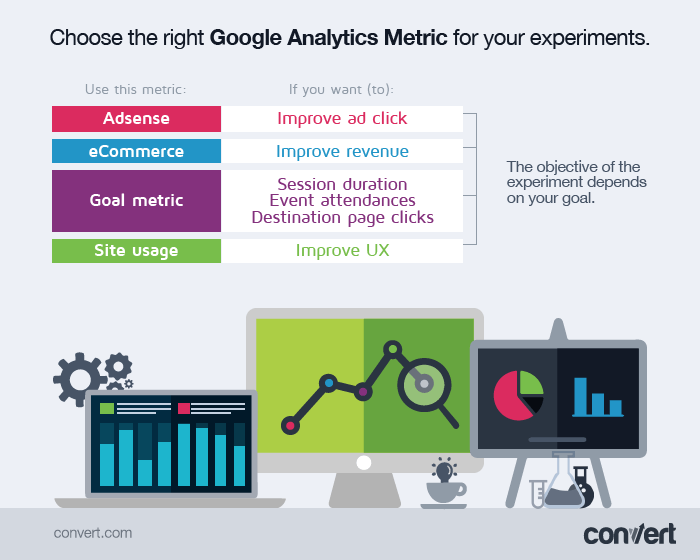
The objective of the experiment depends on your goal.
[Tweet “Conducting split tests with #GoogleAnalytics isn’t a very easy thing to do. #abtesting “]
- Want to improve ad clicks— choose the Adsense option.
- Want to improve revenue— choose eCommerce.
- For session duration, event attendances, or destination page clicks— choose the goal metric.
- For improving the UX choose site usage.
To reference back to the experiment later, it’s always better to name the experiment as something that’s closely related to the theme of your A/B testing- be it your landing page or product. So if it’s a landing page for dentist SEO leads name the experiment as dentist SEO landing page or something similar. Next you need to choose the metric for the experiment. Google Analytics gives you some metrics to choose from like Adsense, Ecommerce, Goals, Site Usage.
Another problem with using Analytics is that creating multiple variations isn’t a single task. What you gain on Analytics being a free for all platform you lose a lot more on creating custom variations.
Tools like Visual Web Optimizer on the other hand enable you to create any number variations with a drag and drop system. They work by changing the Javascript and CSS functions. Analytics severely limits A/B testing with this serious handicap.
[Tweet “The objective of the experiment depends on your goal.#analytics #abtesting”]
The problem with this approach is that this doesn’t “chance” into account. It’s always possible that variation A gave better results purely because of chance and you might end up with the lower converting version eventually.
If it’s your first time there, you will see an overview page for the experiment-setup wizard.
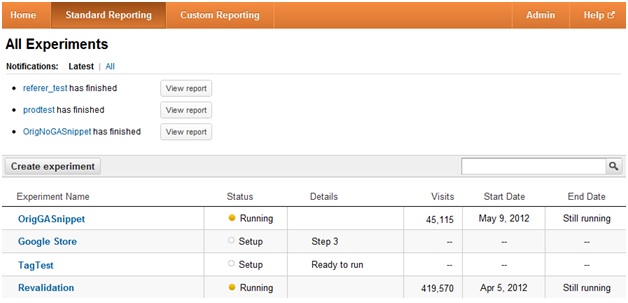
Once you have started experiments your experiments dashboard will resemble something like this:
What are the limits with Google analytics?
The problem with Bandit testing
There’s no way you will be able to create these small changes without calling on your web development team and there’s no way they are going to be able to do it fast enough for you.
There are a lot of paid tools that you can use for A/B testing. But Google Analytics is one of the best free tools which you can use for running A/B testing experiments. It’s readily available for anyone. In this post I will be taking a critical view at Google Analytics’ split testing abilities and try to answer if it’s the right tool for you to be using. In Google Analytics, A/B testing is referred to as a content experiment.
To get started with an experiment click on START EXPERIMENTING.
As Brian Clifton puts it aptly:
“If you sell both umbrellas and t-shirts on a page under test and the weather turns wet for a few days, your umbrellas would be declared the winner (i.e. more sales for that period) without the algorithm waiting for the weather to change back. And there a national holidays – one off events that mess with your data, and so on…”
If you don’t select the option that allows traffic to be distributed evenly across all variations then Analytics sends traffic as per its algorithms. Twice a day they look at the results of your experiment to see which variation has performed better. The variation beats the other one is sent more traffic and the one that is not doing too well gets less traffic.
Only 5 variations are possible
In the next step you need to add in your original web page and your test pages. Simply key in the URL of your landing page and all the variations. Once you add the original and test pages, look at the preview and then click on “Save Changes” to get the code.
But that’s not all.
In Conclusion
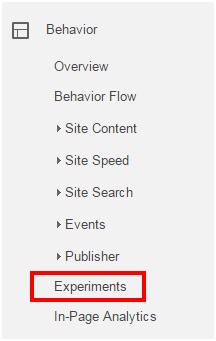
Go to Google Analytics>> Behavior>> Experiments


