18th May 2020 – 
The topic of Conversion Rate Optimization is usually focused on performance data and design. Rarely does an agency invest more resources in the technology as they do in design and marketing, as landing pages and forms utilize web technologies that are very mature today. There isn’t much that can go wrong in terms of basic functionality.
Google Analytics is a staple in the kit of most marketers. But there is more depth to this free tool than you think. Convert is happy to present a series of advanced Google Analytics blogs by ace marketer Phillip Koo of Fluent Group. Check out the last post here. You can also learn more about using Google Analytics to make your CRO efforts more effective here.
But drill down further and you’ll find that there will be a number of technical issues on your pages that are hurting your conversion rates at any given point. Problems range from inconsistent user experience on different screen sizes to users being unable to fill out forms due to CSS issues. Pages are obviously slightly tweaked for mobile users, where some elements were aligned differently or removed altogether to make it mobile responsive. And for the desktop version of your landing page, you expect it to display consistently to all desktop users regardless of which browser they’re using.
- Regional Location
- Browser Type
- Browser Version
- Screen Size
- Speed
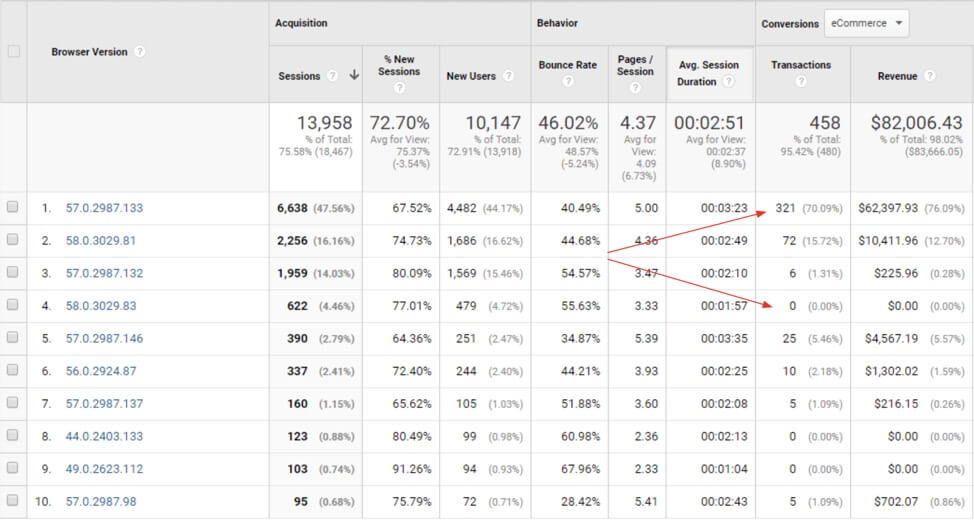
Comparing two rows, one version obviously has a higher rate of conversion while the other has no conversions at all, even though hundreds of sessions have been established using that version. There’s an obvious technical issue with the website when users on the latter version are visiting the site.
- Small mobile screens: 480 pixels and below in width
- Medium mobile screens: 481 to 767 pixels in width
- Large mobile or tablet screens: 768 to 979 pixels in width
- Desktop screens: 980 pixels and above in width
A quick look through all of the standardized reports in your Google Analytics account reveals the vast number of data points it collects for your site. Some of these data points include:
Unfortunately, that doesn’t always happen. There’s code that is commonly unsupported by certain browsers or become outdated, which have the potential to throw off your entire page and ruin the user experience.
If you’ve been following our series on using Google Analytics to Improve your CRO, we speak a lot about leveraging Google Analytics to find easy wins that will instantly boost your conversion rates. If you rely on your creativity alone, you’ll find yourself in an endless cycle of creating new landing page variants and stagnating conversion rates. Introduce an additional dimension to your CRO program and use Google Analytics to monitor the health of your creatives to boost those conversions.
Build Your Reports
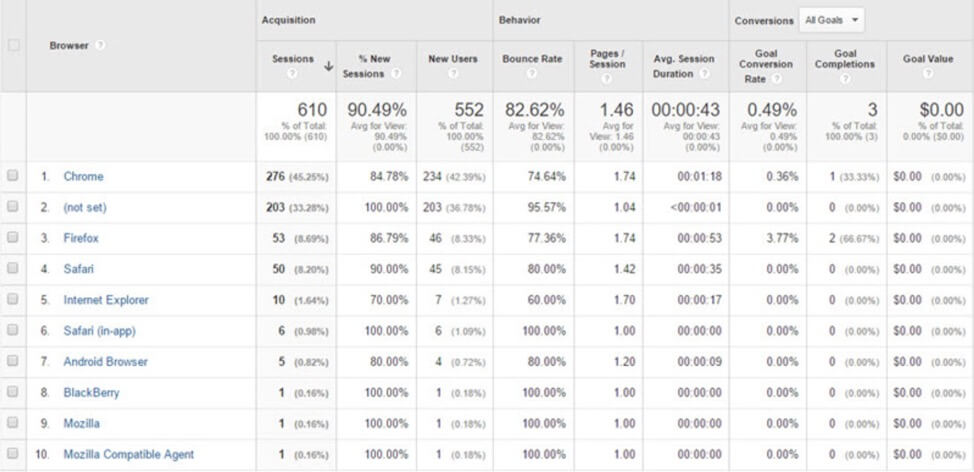
Below is a report that you can easily find or even create (to customize) in your Google Analytics account. The report shows different browser types and their associated conversion rates.
These reports make it easy for you to identify browsers with comparatively low conversion rates and use them to diagnose any issues associated with them.
And although many of these issues are overlooked or easy to miss, fortunately, they’re also easy to correct and can be identified with ease through Google Analytics.
This example uses data from an eCommerce site, which additionally shows the revenue impact of such a technical issue.
Technicalities and Conversion Rates
Each of these data points themselves don’t say much. But when you start comparing this information against your performance data, that’s where you can get insights into technical issues that may be hurting your conversion rates.
Here’s another example of a report that breaks down conversion rates by browser version.
