These environmental factors are changing all the time, too, with the introduction of new lockdown measures, implications of Brexit and market shifts resulting from both.
Another example, in the food industry, search data helps our customers decide when to launch their Christmas, Valentine’s and other seasonal menus. Increasingly, over the past few years, Veganuary has been a big deal for brands in the food sector and we’ve used search data to help our clients decide when the time was right to invest in the trend and even what to put on their menus.
The power of search insights for business intelligence
According to data from McKinsey, retail experienced 10 years’ worth of digital transformation in the space of 90 days, early on in the pandemic last year. Meanwhile, ONS figures for online sales as a percentage of total sales show that, after a dip following the reopening of stores in June, online sales remained higher than pre-Covid levels and started to grow again in October.
— Office for National Statistics (ONS) (@ONS) December 9, 2020
This revealed two locations with high volumes of ad impressions without a local franchise: Manchester and Portsmouth. These are two major cities where our client was spending money on high demand without generating any return whatsoever.
The easiest way to gauge share of search is to type your brand’s name into Google Trends and then add your competitors to see how interest compares.
The problem for businesses throughout this crisis has been that different industries have been hit disproportionately and changing restrictions can impact consumer behaviour overnight.
On the plus side, we spent most of 2020 learning how to deal with such levels of uncertainty, whether we wanted to or not.
The key for brands this year is narrowing down on real-time data so that you’re always using the latest data to inform business decisions. The problem is, collecting data from dozens of sources and then extracting insights from them can be time-consuming, by which point your real-time data isn’t so up-to-date.

Measuring your share of search is more important than ever with the pace of change during these unprecedented times. This is the most reliable way to gauge your market share and the fastest way to measure the success of quick-fire responses using real-time data, as we discussed in the previous section.
This is why we built our own intelligent automation platform, Apollo Insights, which collects real-time search data from hundreds of sources into reports and visualisations that reveal insights as they happen.
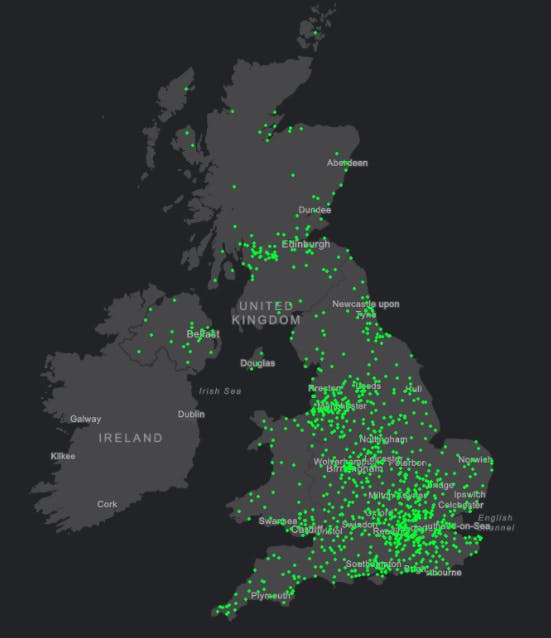
Unfortunately, there are no business intelligence tabs in Google Ads or Search Console (not yet, anyway) so we have to work the raw data to extract valuable insights. For example, for one of our customers with many business locations across the country, we imported geographical search data from Google Ads into Microsoft PowerBI which enabled us to visualise this data in new ways.
One of the biggest lessons for search marketers from last year is that search insights aren’t only for SEO. They’re also the biggest business asset for responding to market shifts quickly, which will be crucial for brands looking to recover and thrive in 2021.
- Searches for “blinds, shades and shutters” were up by 109.95%
- Searches for “office furniture” were up by 83.74%
- Searches for “bicycles and accessories” were up by 71.32%
- Searches for “bakeware” were up by 66.85%
- Searches for “yard, garden and patio” were up by 57.81%
- Searches for “home improvement and maintenance” were up by 45.07%
- Strong decline in searches for consumer electronics
- Strong decline in searches for clothes, cosmetics and beauty
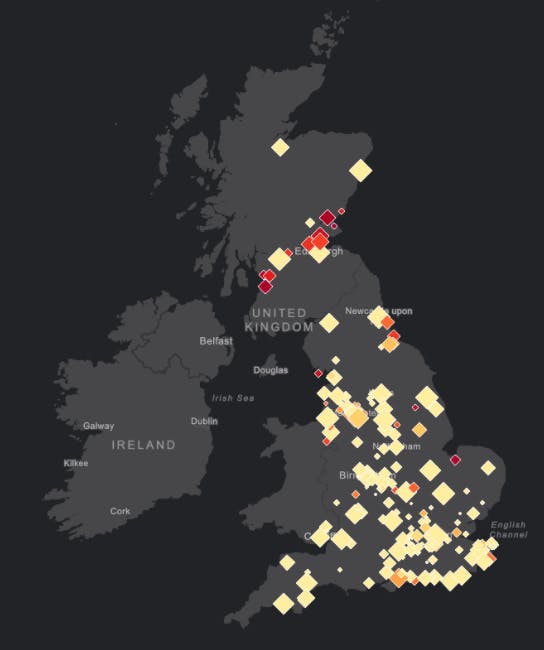
We segmented and refined this data to reveal new insights, such as where our ads were appearing in relation to each branch location. In the visualisation below, yellow represents ad impressions close to a nearby branch while red shows people seeing the ads with no nearby branch and the size of the diamond represents the volume of impressions.
Look at any data visualisation for the past few years and you’re likely to see major spikes or declines for 2020. In many ways, comparing data from the past 12 months to previous years offers limited value because the environmental factors affecting that data have changed so drastically.
While marketers are used to rapid change, 2020 was a year where entire industries could come to a standstill overnight. International travel, restaurant dining and in-store shopping were just a few of the luxuries put on hold yet people in the UK were still spending money – they were just spending it differently.

Turning search data into smarter business decisions
Instead of simply pausing ad spend on these locations, by delving that little deeper into the data, we discovered two prime locations where our client could open new franchises and capitalise on local demand – a major business decision discovered and made thanks entirely to search insights.
In the retail clothing sector, several clients use our search data to inform which clothing categories to prioritise on their homepage, landing pages, email campaigns and blog posts. By comparing seasonal trends to previous years and looking at short-term spikes in interest, we can determine which clothing items are generating the most interest and which ones aren’t looking so hot.
You can also compare changes in search volumes over the past 12 months by using monthly historical searches.
Here’s a quick summary of some of the insights:
Map to help understand best places to open new branches.
Even at the peak of a global crisis, companies that recognised the shifts in consumer interests were able to react to them. Some managed to weather the storm while others were able to thrive by satisfying the rapidly changing needs of consumers.
Map showing Google ad impressions close to a nearby branch (yellow) and people seeing the ads with no nearby branch (red). Size of the diamond represents the volume of impressions.
After a year defined by uncertainty, there’s little promise that life will be any more predictable in the early stages of 2021. Ever-changing lockdown measures, new trade regulations and a years’ worth of unforeseen events make it difficult to predict anything for the next 12 months.
Geographical search data visualised through PowerBI.
Back in June, Vertical Leap published a set of search trends, shared to us by Google, for post-Covid-19 recovery. These insights looked beyond the obvious trends, such as travel booking being down, and provided a more rounded picture of how consumer interests were affected by the pandemic.
See how the U.S. has leapt 10 years forward in 90 days’ time from physical channels to e-commerce. Also, how the acceleration in digital transformation by companies is widening the gap between leaders & laggards and more. https://t.co/hybQkCcBmu pic.twitter.com/mBt7mMc0kI

This revealed a lot of areas where our client was paying for ads that were unlikely to generate in-store visits. Now, our first instinct might have been to rule those areas out with location targeting to stop wasting money on those ads – but what if we dug even deeper into the data?
As we looked at in our search insights for restaurants and takeaways article, local eateries that moved to capitalise on the increased demand for takeaway food were in the best position to make it through lockdown – and not only traditional takeaways but cafes and restaurants that adapted their services to meet the needs of their local area.
This doesn’t give you specific numbers but it does provide a quick, visual comparison to see where you stand against your competitors.

Narrowing down on real-time data
Suddenly, everything marketers thought they knew about consumer behaviour became irrelevant. Fresh outbreaks, new lockdown measures, travel bans and new variants are just some of the events of the past 12 months that impacted purchase habits to an extent we’ve never seen in the digital age.
Throughout this crisis, though, search data has kept us in touch with the biggest concerns, interests, needs and wants of consumers across the country, as they change.
For a more comprehensive measurement of share of search, you’ll need an active Google Ads account that’s spending enough to get full access to keyword data. Basically, you can type all of your competitors into the Keyword Planner tool and then add them to a new ad group to track the organic monthly searches.

With a little help from Google’s Distance Matrix API, we can find the distance to the nearest franchise from every impression location and segment our data to exclude all of the locations with the highest impressions and everywhere less than five miles away from the nearest franchise.
Even at this early stage of the pandemic, search data revealed that consumers were showing less interest in frivolous spending and focusing their attention on activities to improve their health, wellbeing and increased time spent at home.

We’ve talked about SEO being the saviour in times of crisis, as it continues to pull in valuable traffic even if you pause paid campaigns. However, the search data we now have access to can inform so much more than our SEO campaigns. These insights can power smarter business decisions and allow brands to react to market trends in real-time, which proved so important in 2020 – and will continue to do so in the year ahead.
Online shopping has been gaining a greater share of retail sales for a number of years, but the impact of #COVID19 saw it rise sharply as many shops closed.
Throughout 2020, we published search insights for different sectors, ranging from retail to waste management. Some of these insights point towards broad trends, such as the increased share of online purchase but we have to question these after the disruption of Covid-19.
This will also help businesses find new, short-term opportunities while long-term predictions are more difficult to make. An important lesson from the pandemic so far is that new opportunities can be found in surprising places – as we covered in our retail search insights article, back in October.
‘Share of search’ as a measure of market share
At this point, we have to look for weaknesses in our data because this is where opportunities for deeper insights are found. The obvious question that comes to mind is how far away is each of these ad impressions from the nearest branch?
— McKinsey & Company (@McKinsey) November 9, 2020

Share of search compares the number of organic searches for your brand against your direct rivals to map out your market share – and how it changes over time. This is a crucial measurement of your brand’s success during such volatile times and a long-term KPI for search marketing success.
In this climate, if you’re responding to trends after they’ve emerged, there’s a good chance they’ve already shifted again before you fix anything.
After shops reopened, online as a share of total retail dipped only slightly before growing again https://t.co/oOfldUsjW2 pic.twitter.com/x23oU2nJBG
The only way to verify evolving trends is to narrow done on real-time data and compare findings to predictions.
For example, Google data predicts that the share of online purchases will reach 22% by 2024 – a dramatic increase from 14% in 2019. However, it’s difficult to predict what lasting effects the pandemic will have on consumer behaviour, which makes historical data less reliable than it previously was.